
Public Transit · Paratransit · Call Center Analytics
Data. Insights. Better Decisions.
Vaughan's Analytics helps public transit and paratransit agencies — and the call centers that support them — turn scheduling, dispatch, and IVR data into one connected decision system. Power BI, predictive analytics, and reporting automation built for on-time performance, compliance, and rider experience.
- Paratransit Analytics
- Call Center Performance
- Power BI
- Predictive Analytics
- Reporting Automation
Founded by Charles Vaughan
Built for transit operations and the call centers behind them
Vaughan's Analytics specializes in public transit, paratransit, and contact-center analytics — connecting the systems that run daily service into clear, decision-ready insight.
On-time performance you can defend
On-time performance, trip denials, no-shows, cancellations, and scheduling and dispatch efficiency — pulled from your reservation and routing systems into one view.
Service reliability at a glance
Ridership, headway and OTP trends, and cost-per-trip visibility that make planning reviews and board reporting fast instead of frantic.
The contact center, quantified
IVR and ACD data unified: average handle time, hold and abandon rates, agent performance, and call-volume forecasting to staff the right people at the right time.
Reporting that is always audit-ready
NTD submissions, broker and provider scorecards, and SLA reporting automated — accurate, auditable, and delivered on time, every time.
Your operation already generates the data
Reservations, routing, AVL, IVR, and billing all produce plenty of it. The challenge is not a lack of data — it is a lack of connection across the systems that run daily service.
Scheduling & Dispatch
Siloed systems
Spreadsheets
Manual reporting
Call Center
Performance blind spots
Metrics
Competing definitions
The result
Slow board reporting • Reactive compliance • Missed OTP & SLA targets
From data problems to business advantage
What we deliver
A connected capability stack — from data engineering and modeling to Power BI, forecasting, and the daily decisions leaders act on.
Power BI
Power BI development & dashboards
BI Consulting
Business intelligence consulting
Predict
Predictive analytics
Analyze
Data analysis & discovery
Forecast
Forecasting & model development
Engineer
Data engineering & pipelines
Automate
Reporting automation
Advise
Technology consulting
Governance • Security • Data Quality • Adoption
Power BI that drives action
Reporting becomes valuable when it changes what happens next.
- 01Raw data
- 02Trusted model
- 03Live insight
- 04Decision
- Executive scorecards and operational command centers
- Interactive drill-through from enterprise KPIs to individual records
- Automated refreshes and reusable datasets
- Experiences for executives, managers, analysts, and frontline teams
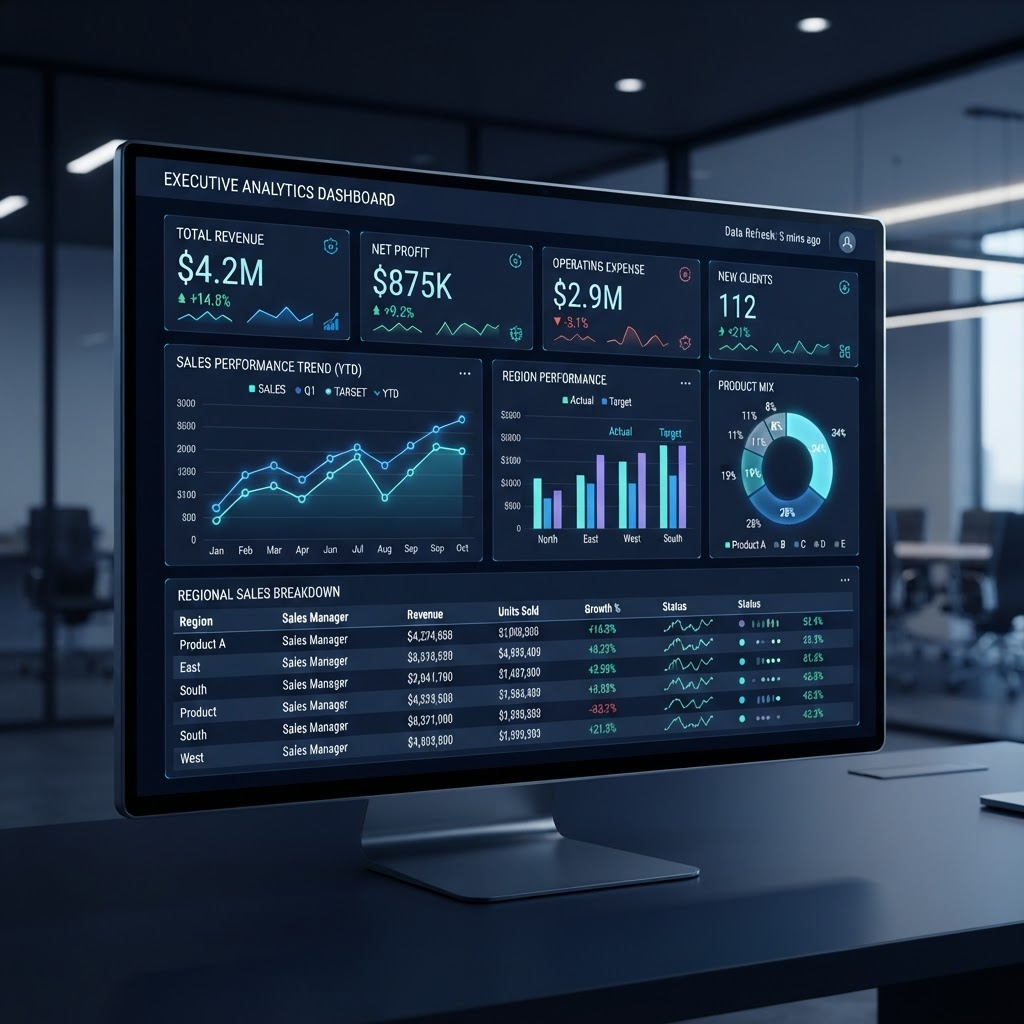
Proof in practice
Contact center & workforce intelligence
Move from isolated metrics to one complete performance narrative.
Proof in practice
Mobility & service performance
Executive visibility with the operational detail needed to intervene.
See what comes next
Progress from explaining the past to shaping the outcome.
Describe
What happened?
Diagnose
Why?
Predict
What is likely?
Act
What should we do?
- Forecast demand, workload, failures, and service risk
- Score assets, providers, or conditions by priority
- Detect anomalies before they become disruptions
- Model scenarios while keeping human review in control
One version of the truth
Reusable models make every dashboard faster, clearer, and more consistent.
Semantic Model
SQL • ETL/ELT • Dimensional Modeling • KPI Governance
Provider contract compliance
Turn contract language into measurable, auditable operating controls.
Requirements
Obligations and evidence
Monitoring
Deadlines and exceptions
Action
Corrective follow-up
Audit
Complete oversight record
Performance management beyond the dashboard
Connect insight directly to accountability, coaching, and follow-through.
Centralize
People, assignments, and measures
Coach
Structured follow-up and accountability
Connect
Reporting insights to daily workflow
One secure front door for every application
Reduce application sprawl without replacing every platform. A unified operations portal that unifies dashboards, tasks, alerts, documents, support, and apps.

Automate the handoffs
Connect systems and move information without manual friction.
Source systems
- APIs
- Databases
- Files
- Vendor platforms
Automation layer
- Ingest
- Validate
- Transform
- Orchestrate
Business action
- Refresh
- Alert
- Route
- Resolve
Reliable data movement. Faster decisions. Fewer manual handoffs.
Governance built in
Security, quality, and accountability are part of the architecture — not an afterthought.
Access
Least privilege
Quality
Monitor & reconcile
Control
KPIs & models
Audit
Validate & approve
Trusted Operations
A practical path from idea to impact
Start focused. Prove value. Scale with confidence.
Discover
Outcomes & pain points
Connect
Data & applications
Model
Trusted definitions
Build
Solutions & workflows
Validate
Users & controls
Scale
Govern & expand
Builders, not just advisors
Strategy matters. Working systems create the value.
Business
Requirements, outcomes, adoption
Data
Models, pipelines, analytics
Technology
Applications, integration, automation
We do not stop at the recommendation — we build the system that delivers it.
Let's build.
Connect your systems. Clarify your performance. Act sooner. Start with one high-value use case.
Vaughan's Analytics • Charles Vaughan